Outcome Measurement.
Quantify the value delivered by multi-agent orchestration. Move beyond cost accounting to answer the question that matters: "Did this actually help?" Passive observation of task completion rates, time-to-resolution, rework frequency, and quality trending across every conductor workflow.
Problem Statement
Agent Economics (PRD 10) answers "how much did this cost?" but not "how much value did this deliver?" Operators can see token spend, model routing decisions, and per-agent cost breakdowns, but have no way to correlate that spend with actual outcomes. The system tracks inputs (tokens consumed, models invoked) without tracking outputs (tasks completed, quality achieved, time saved).
Without outcome measurement, optimization becomes guesswork. An operator might see that Opus costs 10x more than Haiku for a particular task type, but has no data on whether the Opus run produced a first-pass success while the Haiku run required three rework cycles. The cost comparison is meaningless without outcome context.
No Task Completion Rates
Agents report success/failure, but there is no independent measurement of whether the task actually achieved its intended outcome after verification.
No Time-to-Resolution Tracking
No measurement of elapsed time from task dispatch to verified completion, making it impossible to identify bottlenecks or estimate future delivery timelines.
No Rework Frequency Data
Retry counts exist in conductor state, but there is no aggregation across workflows to identify which agent types, task categories, or tier levels produce the most rework.
No Quality Trending
Gemini validation verdicts (PASS/FAIL/PARTIAL) are recorded per-agent but never analyzed over time. Is quality improving, degrading, or plateauing? Nobody knows.
No Cost-per-Outcome
Agent Economics tracks cost-per-token and cost-per-agent. The metric that matters is cost-per-successful-outcome, and it does not exist today.
No Value Attribution
When the system saves an operator 4 hours on a MAJOR workflow, there is no framework to quantify that time savings, quality improvement, or risk reduction as measurable value.
Architecture
Outcome Measurement operates as a passive observation layer. It never modifies conductor state, never blocks agent dispatch, and never introduces latency into the orchestration pipeline. It reads events, computes metrics, and stores results in a dedicated Qdrant collection, completely decoupled from the orchestration path.
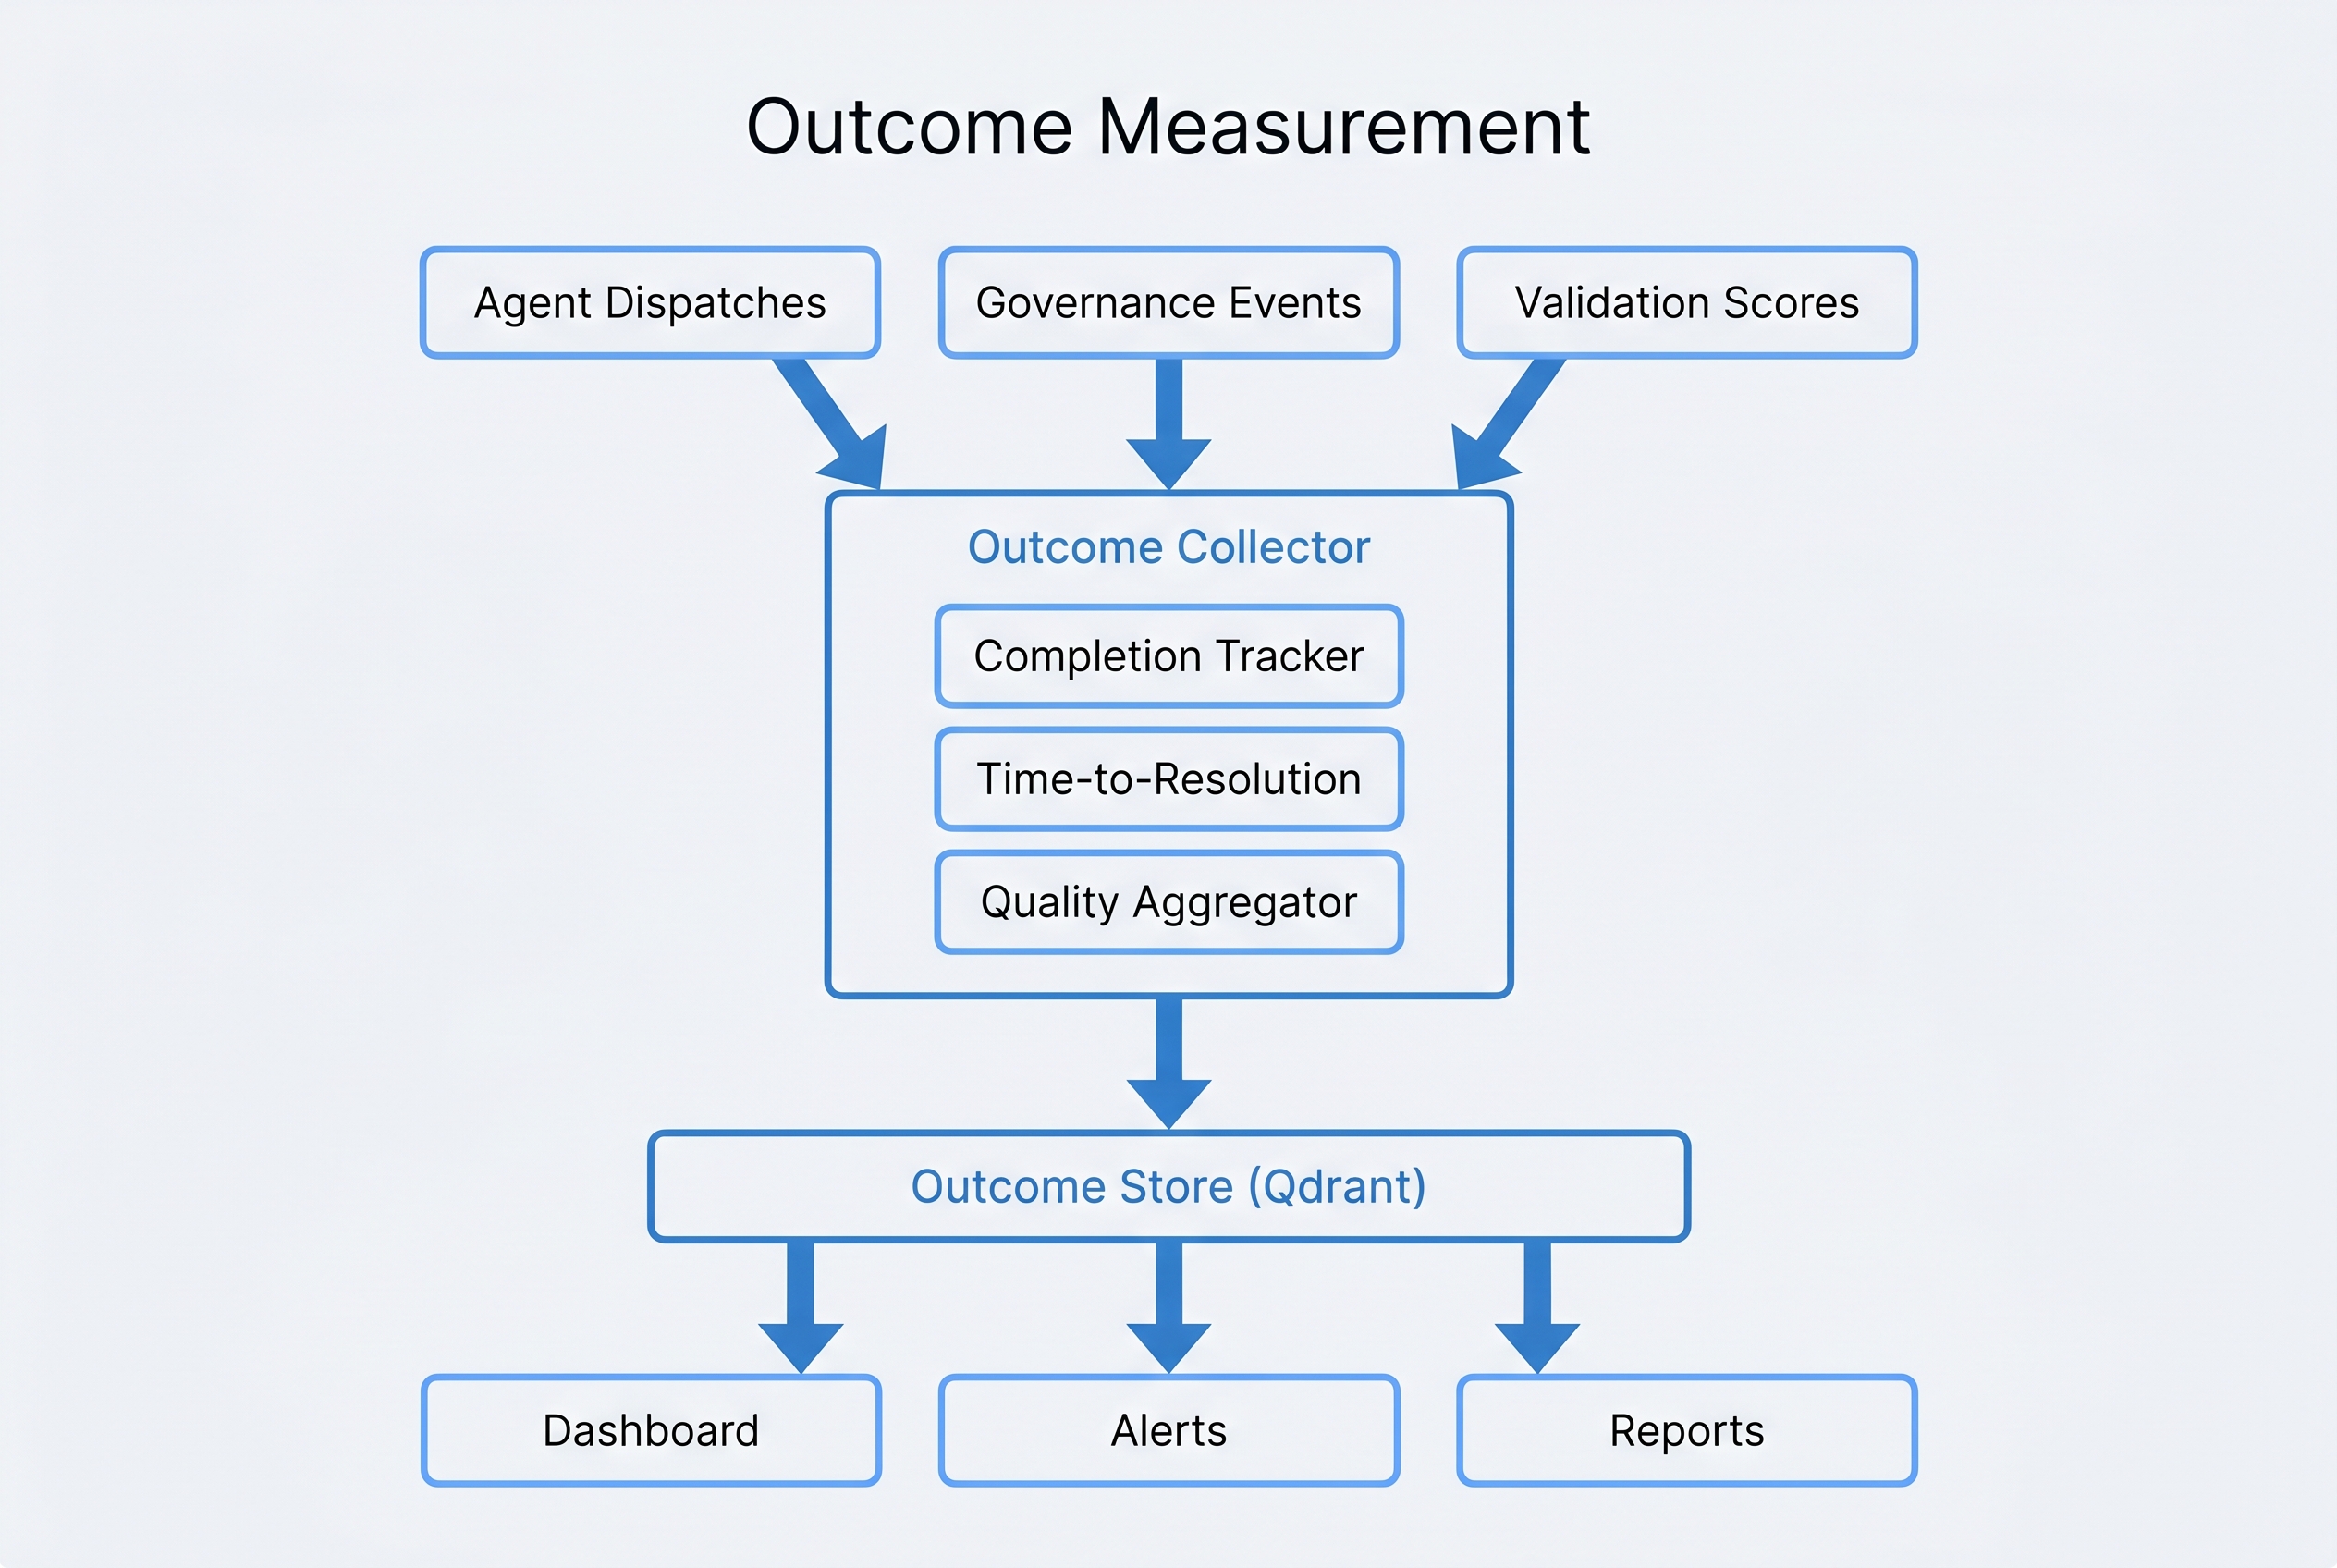
Passive Observation Model
The Outcome Collector reads conductor-state.json changes, Gemini validation results, and governance audit events without modifying any source data. Zero performance impact on orchestration.
Compute-then-Store Pipeline
Raw observations are transformed into 8 standardized outcome metrics before storage. No raw event data is persisted in the outcome store; only computed metrics and attribution records.
Dual Retention Strategy
Granular per-task metrics retained for 90 days. Aggregated metrics (per-agent-type, per-tier, per-project) retained indefinitely for long-term trend analysis.
Key Components
8 Outcome Metrics
Every metric is computed from observable data already present in conductor state, Gemini validations, and governance events. No additional instrumentation required from agents.
Core Components
Outcome Collector
Passive observer that monitors four event streams: conductor state transitions, Gemini validation verdicts, governance audit events, and agent completion signals. Emits structured observation records without modifying source data.
Value Attribution Framework
Maps outcomes to five value categories: time savings (estimated hours saved), quality improvement (defect prevention), throughput gain (tasks per unit time), risk avoidance (security/compliance catches), and knowledge preservation (institutional memory captured).
Outcome Store
Dedicated Qdrant collection (outcome_metrics) with vector embeddings for semantic similarity search across outcomes. Enables queries like "show me outcomes similar to this failing pattern" for root cause analysis.
Outcome Dashboard
Extends the Memory Dashboard (PRD 6) with a dedicated outcome analytics tab. Real-time metric visualization, trend charts, agent comparison views, and cost-effectiveness rankings.
Outcome Reports
Two report types: weekly digest (automated summary of outcome trends, top-performing agents, emerging issues) and project retrospective (complete outcome analysis for a completed workflow, from planning through delivery).
Baseline Manager
Operator-defined performance baselines per metric. Outcomes are compared against baselines to generate improvement percentages. Baselines auto-adjust quarterly based on rolling averages, with operator override capability.
Requirements
| ID | Requirement | Priority |
|---|---|---|
| REQ-OM-001 | System SHALL compute task completion rate as the ratio of verified-complete tasks to total dispatched tasks, segmented by tier (TRIVIAL/MINOR/STANDARD/MAJOR), agent type, and project. | MUST |
| REQ-OM-002 | System SHALL track time-to-resolution from agent dispatch timestamp to verified-completion timestamp with millisecond precision, excluding operator-blocked wait time. | MUST |
| REQ-OM-003 | System SHALL compute first-pass success rate from Gemini validation verdicts, counting only tasks that receive PASS on the initial validation without any prior FAIL or PARTIAL verdict. | MUST |
| REQ-OM-004 | System SHALL track rework frequency as the count of retry cycles per task, aggregated by agent type, task category, and tier level, with alert thresholds configurable by operator. | MUST |
| REQ-OM-005 | System SHALL compute quality score trend as a 7-day rolling average of Gemini validation scores, with separate trend lines per agent type and a combined system-wide trend. | MUST |
| REQ-OM-006 | System SHALL compute recovery rate as the percentage of initially-failed tasks (FAIL or PARTIAL <70%) that subsequently reach verified-complete status through retry or escalation. | SHOULD |
| REQ-OM-007 | System SHALL compute context efficiency as the ratio of output tokens in verified-complete deliverables to total input+output tokens consumed during task execution. | SHOULD |
| REQ-OM-008 | System SHALL compute cost-per-successful-outcome by dividing total Agent Economics cost for a task (including retries) by a binary success indicator (1 for verified-complete, 0 for failed). | MUST |
| REQ-OM-009 | Outcome Collector SHALL operate in read-only mode, never modifying conductor-state.json, Gemini validation records, or governance audit events. Observation must not affect the observed system. | MUST |
| REQ-OM-010 | Value Attribution Framework SHALL map each successful outcome to at least one of five value categories (time savings, quality improvement, throughput gain, risk avoidance, knowledge preservation) with quantified estimates. | SHOULD |
| REQ-OM-011 | Outcome Store SHALL retain granular per-task metrics for 90 days and aggregated metrics indefinitely. Granular records older than 90 days SHALL be compacted into aggregate summaries before deletion. | MUST |
| REQ-OM-012 | Outcome Dashboard SHALL extend the Memory Dashboard (PRD 6) with real-time metric visualization, including trend charts, agent comparison views, and cost-effectiveness rankings, updating within 30 seconds of metric computation. | SHOULD |
| REQ-OM-013 | System SHALL generate automated weekly digest reports summarizing outcome trends, top-performing agents, degradation alerts, and cost-efficiency changes relative to prior week. | COULD |
| REQ-OM-014 | Operator SHALL be able to define custom performance baselines per metric, per agent type. System SHALL compare outcomes against baselines and compute improvement percentages in all dashboard views and reports. | SHOULD |
Design Decisions
Key architectural and design choices, with rationale for each decision.
- Passive observation, never active instrumentation. The Outcome Collector reads existing data streams (conductor state, Gemini verdicts, governance events) rather than requiring agents to emit outcome telemetry. This eliminates the risk of observation affecting agent behavior and requires zero changes to existing agents.
- Operator-defined baselines, not system-imposed targets. Performance baselines vary dramatically by project type, team size, and domain complexity. The system provides baseline suggestions from historical data but requires operator confirmation. Auto-adjustment happens quarterly with operator override.
- Separate Qdrant collection for outcome data. Outcome metrics are stored in a dedicated
outcome_metricscollection rather than co-locating with memory or governance data. This enables independent retention policies, dedicated vector indexes for outcome similarity search, and clean separation of concerns. - Extend existing dashboard rather than build standalone. The Memory Dashboard (PRD 6) already provides the infrastructure for real-time data visualization. Adding an outcome analytics tab leverages existing authentication, layout, and deployment rather than creating a parallel dashboard that operators must monitor separately.
- Exactly 8 metrics, no more. Every proposed metric was evaluated against three criteria: is it observable from existing data, is it actionable by an operator, and does it measure outcomes (not inputs)? Metrics like "tokens consumed" and "model selection accuracy" were excluded because they measure process, not outcome.
- 90-day granular retention with indefinite aggregates. Per-task granular data is essential for debugging and root cause analysis but grows linearly with workload. The 90-day window provides sufficient history for trend analysis. Aggregated data (per-agent-type, per-tier, per-project) is compact enough to retain indefinitely for long-term trending.
Integration Map
Outcome Measurement connects to 8 other PRDs in the ecosystem. Each integration is directional: Outcome Measurement reads from source systems and writes to presentation layers.
| Integration | Direction | Data Exchanged |
|---|---|---|
| Conductor (PRD 2) | Reads from | State transitions, phase completions, agent dispatch records, tier classifications, and task verification results from conductor-state.json. |
| Agent Economics (PRD 10) | Reads from | Per-task cost data, model routing decisions, and token consumption records. Used to compute cost-per-successful-outcome and cost-effectiveness rankings. |
| Governance (PRD 5) | Reads from | Governance audit events including approval gate decisions, policy violations, and compliance checks. Feeds into risk avoidance value attribution. |
| Code Assurance (PRD 8) | Reads from | Quality gate results, test pass rates, and security scan outcomes. Provides independent quality signal for first-pass success rate calculation. |
| Self-Healing (PRD 12) | Reads from | Recovery events and auto-remediation records. Feeds recovery rate metric and provides data on autonomous system resilience. |
| Memory Dashboard (PRD 6) | Writes to | Outcome analytics tab with real-time metric visualization, trend charts, and agent comparison views. Extends existing dashboard infrastructure. |
| Memory System (PRD 4) | Reads/Writes | Reads historical outcome patterns for baseline computation. Writes outcome summaries for cross-session context and institutional memory. |
| Event-Driven (PRD 13) | Subscribes | Subscribes to conductor events via event bus for real-time observation. Publishes outcome metric events for downstream consumers (alerts, reports). |
Prompt to Build It
Copy and paste this prompt into Claude Code to begin implementing Outcome Measurement. It references the architecture, metrics, and integration points defined in this PRD.
Build the Outcome Measurement system (PRD 15) for the conductor plugin ecosystem.

## Context
Agent Economics (PRD 10) tracks cost but not value. We need a passive observation
layer that computes outcome metrics from existing conductor data without modifying
any source systems.

## Architecture
- Outcome Collector: passive observer reading conductor-state.json transitions,
  Gemini validation verdicts, governance audit events, and agent completion signals
- Metric Compute: transforms observations into 8 standardized metrics
- Outcome Store: dedicated Qdrant collection (outcome_metrics) with 90-day
  granular retention and indefinite aggregate retention
- Dashboard: extends Memory Dashboard (PRD 6) with outcome analytics tab
- Reports: automated weekly digest and project retrospective

## 8 Outcome Metrics to Implement
1. Task Completion Rate — verified-complete / total dispatched, by tier + agent
2. Time-to-Resolution — dispatch to verified-complete, excluding blocked time
3. First-Pass Success Rate — PASS on initial Gemini validation, no retries
4. Rework Frequency — retry cycles per task, by agent type + category
5. Quality Score Trend — 7-day rolling average of Gemini validation scores
6. Recovery Rate — initially-failed tasks that reach verified-complete
7. Context Efficiency — output tokens in deliverables / total tokens consumed
8. Cost per Successful Outcome — Agent Economics cost / success binary

## Value Attribution Framework
Map each outcome to: time savings, quality improvement, throughput gain,
risk avoidance, knowledge preservation. Quantify estimates per category.

## Key Constraints
- Read-only observation: NEVER modify conductor-state.json or source data
- Operator-defined baselines with quarterly auto-adjustment
- Separate Qdrant collection, not co-located with memory data
- 90-day granular + indefinite aggregate retention
- Dashboard updates within 30 seconds of metric computation

## Integration Points
- Reads: Conductor (PRD 2), Agent Economics (PRD 10), Governance (PRD 5),
  Code Assurance (PRD 8), Self-Healing (PRD 12)
- Writes: Memory Dashboard (PRD 6), Memory System (PRD 4)
- Subscribes: Event-Driven (PRD 13) event bus

## Requirements
14 requirements (REQ-OM-001 through REQ-OM-014). MUST-priority requirements
are non-negotiable: task completion rate, TTR, first-pass success, rework
frequency, quality trend, cost-per-outcome, read-only observation, and
retention policy.